Systems of Linear Equations
14. Consider the following rabbit-fox models and an
initial population size
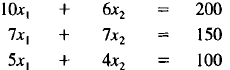
of R = 100, F = 100. In each case, compute the population sizes after
1 month, after 2 months, and after 3 months.

15. Consider the following goat-sheep models, where the
two species compete
for common grazing land. In each case, compute the population
sizes after 1 month, after 2 months, and after 3 months if the initial
population is 50 goats and 100 sheep.
16. This exercise concerns the rabbit-fox model in
equations (15). For given
initial population sizes, calculate the population sizes after 1 month,
after 2 months, and after 3 months. Also plot the trajectory of population
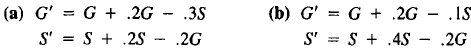
sizes from the starting values to the stable sizes (as in Figure 1.8). The
initial sizes are
(a) R = 30, F = 24
(b) R = 8, F =3
(c) R = 8, F = 10
(d) R = 10, F = 10
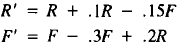
17. Consider the rabbit-fox model
What is the equation of the line of stable population
sizes? For given
initial population sizes, calculate the population sizes after 1 month,
after 2 months, and after 3 months. Also predict the stable sizes to
which these populations are converging. Compare your numbers with
the calculations in Exercise 16. The initial sizes are
(a) R = 30, F = 24
(b) R = 8, F =3
(c) R = 8, F = 10
(d) R = 10, F = 10
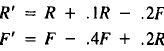
18. Consider the rabbit-fox model
On a graph plot the following:
(a) The line of stable population sizes.
( b) The trajectory of population sizes starting from (10, 15).
(c) The trajectory of population sizes starting from (10, 30).
(d) The trajectory of population sizes starting from (20, 10).
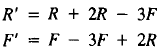
19. Consider the rabbit-fox model
On a graph plot the following:
(a) The line of stable population sizes.
(b) The trajectory of population sizes starting from (10, 15).
(c) The trajectory of population sizes starting from (1, 2).
(d) How do the trajectories of this model differ from those in Figure
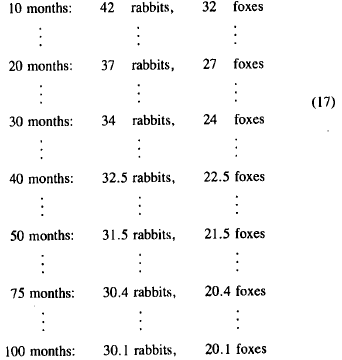
20. Use a computer program to follow the behavior of the
nonlinear rabbit-fox
model in (19) over a period of 100 months (as in Figure 1.9)
with the following starting values:
(a) R = 6, F = 6
(b) 100, 100
(c) 10, 10
21. In Example 4, if the change in R is. 1R -.01RF in 1 month, then in
1 day we would expect  of such a change
[i.e.,
of such a change
[i.e.,
 ];
];
similarly for the change in foxes. Write out the full set of equations for
this model with time measured in days. Starting with R = 3, F = 3,
follow the populations as before for 3000 days (= 100 months). (Use
a computer program.) How do your results compare with those in table
(20)?
Projects
22. Use a computer program to follow the populations for many periods in
the models in Exercises 14 and 15. Try a couple of different starting
population sizes. In each case describe in words the long-tern trends
of the populations.
23. Make a thorough analysis of long-term trends for the rabbit-fox model
for different values of the positive parameters b, d, e,
e'. That is, list
all possible long-term trends and give conditions on the parameters that
tell when each trend occurs. For example, one trend is that both populations
become extinct, with rabbits dying out first. Deteonine the
conditions experimentally by trying many different specific parameter
values and in each case computing the population sizes over many
months.
Linear Programming and
Models Without Exact Solutions
In this section we examine two very important variations on the problem of
solving n linear equations in n unknowns. We illustrate these variations with
the refinery problem from Section 1.2.
Example 1. Refinery Problem Revisited with
One Refinery Broken
The original refinery problem had three refineries and three products:
heating oil, diesel oil, and gasoline. We wanted the production levels,
 , of the refineries to meet demands of 500
gallons of heating
, of the refineries to meet demands of 500
gallons of heating
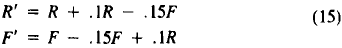
Note that in (12), the order of the terms +e'R and -dF in the second
equation was reversed. Let us solve this pair of linear equations for R
and F. Obviously, R = F = 0 is a solution. But we want another
solution. We use the standard method for eliminating one of the variables
in (12): Multiply the first equation by d and the second by e and
then subtract the second from the first.
If bd -ee' = 0, then R (and F) need not be 0. Note that
Suppose that  . Then one
can show that Rand F are solutions to
. Then one
can show that Rand F are solutions to
(11) if and only if
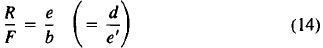
For example, the system
has stable values R = IS, F = 10 or R = 6, F = 4. In fact,
any
pair (R, F) is stable in (15) if
Stable R, F values for (15): or
or 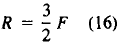
Further, if we start with values for Rand F that are not
stable, then
over successive months the rabbit and fox populations always move
toward one of these stable pairs of values, just like the Markov chain.
In this model the "law of nature" is that there should be a 3 : 2 ratio
of rabbits to foxes. Figure 1.8 shows sample curves along which unstable
values move in approaching a stable value. For example, if we
start iterating (15) with R = 50, F = 40, we have
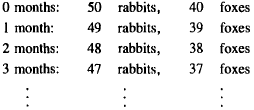
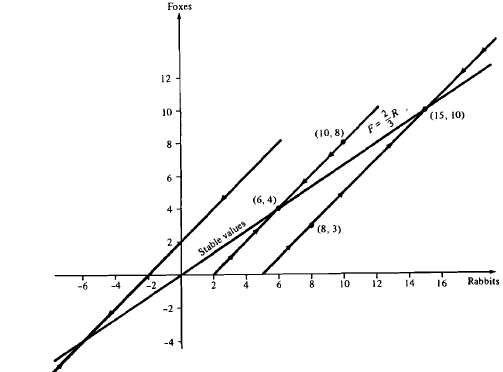
Figure 1.8 Stable values and trajectories to stable values in rabbit-fox growth model.
|
Corner Coordinates |
Intersecting Constraints |
Objective Function |
 |
c≥ 0 and W≥ 0 C≥ 0 and L and Land and Capital Capital and Labor Labor and W > 0 |
 |
For many years, the Federal Farm Program has offered crop
subsidies in
order to influence both the types of crops grown and the total number of
acres planted.
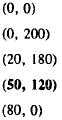
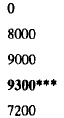
To illustrate how a crop subsidy can cause land to be taken out of
production, let us suppose in Example 4 that the farmer receives a subsidy
I for corn that increases the revenue from $60 to $90 per acre. Then the
objective function is now 90C + 40W. The values of this new objective
function at the corner points of the feasible region are shown in Table 1.3.
The new optimal strategy is to plant 50 acres of corn and 120 acres of wheat,
for a total of 170 acres. The subsidy results in the farmer removing 30 acres
from production.
Section 1.4 Exercises
Summary of Exercises
Exercises 1-5 involve overdetermined systems and regression. Exercises
6-12 involve linear programming. Exercise 13 tells how to convert a system
of equations into a system of inequalities (this conversion is discussed further
in Chapter 4).
1. Use a trial-and-error approach to estimate as closely as possible an
approximate solution to the refinery problem in Example 1.
2. (a) Repeat Exercise 1, but now refinery 2 rather than refinery 3 is
missing.
(b) Repeat Exercise 1, but now refinery 1 rather than refinery 3 is
missing.
(c) If you had to close down one refinery, which refinery would you
pick in order to meet the demand as closely as possible with the
remaining two refineries?
3. Consider the following system of equations, which might represent
supply-demand
equations for chairs, tables, and sofas from two factories:
| Factory I | Factory 2 | Demand | |
| Chairs: |
 |
||
| Tables: | |||
| Sofas: | |||
Find an approximate solution to this system of equations
by trial and
error.
4. For the following sets of x-y points, estimate a line to fit the points as
closely as
possible.
(a) (I, I), (2, 3), (3, 2), (4, 6), (5,5)
(b) (I, 6), (2, 4), (3, 3), (3, 2), (4, -I), (4, 0)
5. Suppose that the estimate for GPA in college, in Example 2 had been

where  and
and
 are the GPAs in mathematics/science,
English, and humanities/languages. Based on this predictor, on which
courses should students work hardest (if students want to improve their
expected college GPA)?
6. Find a solution to the refinery problem in Example 3 in which the values
of x2
and x3 are the same.
7. Change the labor constraint in the crop linear program of Example 4 to
be 4C + 2W = 320. Now what would be the optimal solution?
8. Suppose that a Ford Motor Company factory requires 7 units of metal,
20 units of labor, 3 units of paint, and 8 units of plastic to build a car,
while it requires 10 units of metal, 24 units of labor, 3 units of paint,
and 4 units of plastic to build a truck. A car sells for $6000 and a truck
for $8000. The following resources are available: 2000 units of metal,
5000 units of labor, 1000 units of paint, and 1500 units of plastic.
(a) State the problem of maximizing the value of the vehicles produced
with these resources as a linear program.
(b) Plot the feasible region of this linear program.
(c) Solve this linear program by the method iri Example 4, by determining
the coordinates of the corners of the feasible region and
finding which corner maximizes the objective function.
Hint: By looking at the objective function, you should be able to
tell which corners are good candidates for the maximum.
9. Suppose that a meal must contain at least 500 units of vitamin A, 1000
units of vitamin C, 200 units of iron, and 50 units of protein. A dietician
has the following two foods from which to choose: