Quadratic Equations and Functions
Graphing Functions
Problem I: For the function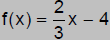 Set the Window on your calculator as given: Xmin = -1 Xmax = 1 Xscl = 0.5 Ymin = -1 Ymax = 1 Yscl = 0.5 Graph the function. Set the Window on your
calculator as given : Graph the function. Set the Window on your calculator as given: Graph the function. |
Problem 2: For the function f(x) = 9x - 0.1x2
Set the Window on
your calculator as given Graph the function. Set the Window on your calculator as given: Graph the function. Set the Window on your calculator as given: Graph the function. |
| Problem 3: For the function f(x) = 0.1x3 - 1.5x2 + 8
Set the Window on your calculator as given: Graph the function. Set the Window on your calculator as given: Graph the function. Set the Window on your calculator as given: Graph the function. |
Problem 4: For the function f(x) = x4 - 8x2 - 10 Set the Window on your calculator as given: Graph the function. Set the Window on your calculator as given: Graph the function. Set the Window on your calculator as given: Graph the function. |
Problem 5. For the function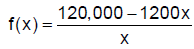 |
|
| Set the Window on your calculator as given: Xmin = -10 Xmax = 10 Xscl = 1 Ymin = -10 Ymax = 10 Yscl = 1 Graph the function. Set the Window on your calculator as given: Graph the function. Set the Window on your calculator as given: Graph the function. |
Set the Window on your calculator as given: Xmin = -200 Xmax = 200 Xscl = 50 Ymin = -2000 Ymax = 5000 Yscl = 1000 Graph the function. Set the Window on your calculator as given: Graph the function. |
Rational Functions
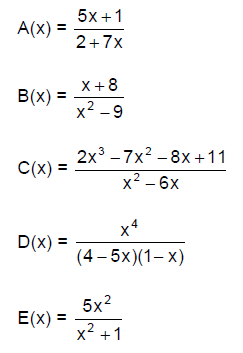
1. For each of the following rational functions:
a. Find the domain.
b. Find the vertical asymptote(s), if any. If no vertical asymptote, write “No
VA”.
c. State whether the function has a horizontal asymptote, a slant asymptote or
neither; then state the equation of the horizontal or slant asymptote, if any.
2. A rare species of insect was discovered in the rain
forest. In order to protect the species,
environmentalists declare the insect endangered and transplant the insects into
a
protected area. The population of the insect t months after being transplanted
is
given by P(t).
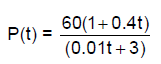
a. How many insects were discovered? In other words, what
was the population
when t = 0?
b. What will the population be after 5 years?
c. Determine the horizontal asymptote of P(t). What is the largest population
that the
protected area can sustain?
d. Graph P(t).
Polynomial and Rational Inequalities
Solve the following polynomial inequalities by first
writing them in general form, factoring (if needed) to identify boundary points,
drawing a number line with boundary points labeled, and testing each interval.
Express the solution in interval notation.
1. x2 > 7x
2. 12x2 < 37x + 10
3. (x + 2)(x – 5)(x + 7) ≤ 0
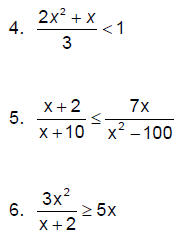
Solve the following rational inequalities by first writing
them as a single simplified rational expression on one side and zero on the
other side of the inequalities. Identify the boundary points by labeling them on
a number line and then testing the intervals. Express the solution in interval
notation.
Applications
7. The profit from selling x pieces of handmade jewelry can be modeled by
the
equation P(x) = –x2 + 130x – 3000. What is the range of profitable orders (P(x)
> 0)?
8. The difference between the value of a piece of
equipment and what is owed on it is
modeled by the expression
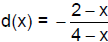 ,
where x is the number of years since
,
where x is the number of years since
the equipment was purchased. When does the amount owed exceed the value of
the equipment (d(x) < 0)?