A Library of Functions
Definition of a Function
1. Definition: y is a function of x if we can associate a unique value of y
to each value
of x. We call y the dependent variable and x the independent variable where
y = f(x).
2. The domain of a function is the set of all possible values of the independent variable.
The range of the function is the corresponding set of values of the dependent variable.
3. Proportionality :
y is directly proportional to x if there exists a constant k such that
y = kx.
y is inversely proportional to x if there exists a constant k such that
y = k/x.
(i.e. y is proportional to the reciprocal of x).
Linear Functions
1. Definition: A function is linear if any change in the independent variable
causes a
proportional change in the dependent variable.
2. Representation of a linear function:
y = f(x) = mx + b
where m is the slope of the graph and b is the value of y when x = 0.
To compute the slope:
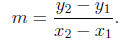
We can also describe m as the change in y for a unit change in x.
3. Given a point (x1, y1) on a line and the slope m of the line, we can write
the
equation of the line as
y − y1 = m(x − x1).
4. A function is linear if and only if for equal differences in x values
there is a constant
difference in y values. How does this relate to the slope of the function?
Quadratic Functions
1. Definition: A function is quadratic if it satisfies the formula y = f(x) = ax2+bx+c.
2. The shape of the graph is determined by whether a > 0 (shaped like x2) or
a < 0
(shaped like −x2).
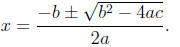
3. The roots of the function are at
In particular the quadratic has no roots if
 exactly
one root if
exactly
one root if
 and
two roots if
and
two roots if
4. A quadratic function has a minimum value at
 when
a > 0.
when
a > 0.
5. A quadratic function has a maximum value at
 when
a < 0.
when
a < 0.
Polynomial and Rational Functions
1. A power function is a function where the dependent variable is
proportional to a
power of an independent variable. The general form is:
where k and p are constants.
2. A polynomial is a function of the form

where each of
 is a constant.
The largest power of x for which the coefficient of x is non zero is called
the degree
of the polynomial.
3. The graph of an nth degree polynomial turns around at most n − 1 times. An
nth
degree polynomial will have at most n roots or zeros.
4. As
 ,
the polynomial p(x) will look like the power function
,
the polynomial p(x) will look like the power function
 where n
is the degree of the polynomial.
5. A rational function is a function of the form
where p(x) and q(x) are polynomials.
6. r(x) will have vertical asymptotes whenever q(x) = 0 (after simplification) .

Inverse of a function
1. A function y = f(x) will have an inverse if and only if for every y there
is a unique
x that maps to it.
2. Computing inverses from a table- just read the table backwards -i.e. your
independent
variable is the right column and your dependent variable is the left column.
3. To compute inverses algebraically, given y = f(x), solve for x in terms of y.
4. Given y = f(x) an invertible function, the domain of f-1(x) is the range
of f and
the range of f-1 is the domain of f.
5. To graph the function f-1(x) given the graph of f(x) reflect the graph of
f about
the diagonal y = x.
6. A function will have an inverse if and only if the graph of the function
intersects
every horizontal line at most once.
7. A function that is only increasing or only decreasing will have an inverse.
8. Sometimes a function might have an inverse in a specific domain. For
example the
function
f(x) = x2
has an inverse if the domain of the function is restricted to only the positive numbers.
9. If a function has a horizontal asymptote at y = k then the inverse
function will
have a vertical asymptote at x = k.
Transforming and combining functions
1. Shifts and stretches: Given a function y = f(x),
(a) Replacing y by y − k moves a graph up by k or down if k is negative. Ie.,
if
k is positive, y = f(x) + k has the same graph as y = f(x) but shifted up on
the y axis by k ( and down if k is negative.)
(b) Replacing x by x − k shifts a graph to the right by k if k is positive
and to
the left if k is negative. Ie., y = f(x−k) has the same graph as y = f(x) but
shifted to the right k units if k is positive and shifted to the left k units if
k
is negative.
(c) Multiplying the function by a constant k:
If k > 0, the function y = kf(x) will look like y = f(x) except stretched
vertically if k > 1 or shrunk if 0 < k < 1.
If k < 0, y = kf(x) will look like y = f(x) reflected about the x-axis and then
stretched if k < −1 and shrunk otherwise.
2. Sums of Functions :
If we are given two (or 3, 4,...) functions f(x) and g(x) then the sum of the
two
functions is also a function. That is, we can create a new function h(x) where
the
value of h(x) at any point the sum of the values of f(x) and g(x) at that point.
Thus we can write
h(x) = f(x) + g(x).
The domain of h will be all x where both f(x) and g(x) are defined. Similarly
the
difference of two functions (f(x) − g(x)) will also be a function.
3. Composition of functions:
A composite function or a function of a function is a function C(x) which can be
written as C(x) = f(g(x)) for two functions f(x) and g(x).
Given an x we can compute C(x) by first computing y = g(x) and then computing
z = f(y). Thus C(x) = z.
4. The domain of C(x) is all x such that g(x) exists and g(x) is in the domain of f.
5. In general f(g(x)) ≠ g(f(x)).
6. The composition of a function f(x) and its inverse f-1(x):
f(f-1(x)) = f-1(f(x)) = x.
Exponential Functions
1. Definition of an exponential function:
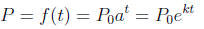
where P0 is the initial quantity (when t = 0) and a is the base of the function).
2. A function is exponential if and only if for equal differences in t
values, there is a
constant ratio in P(t) values. This ratio is the base a of the function.
3. Restrict a such that 0 < a < 1 and a > 1.
Exponential Growth: a > 1
Exponential Decay: 0 < a < 1
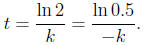
4. Doubling time of a function with exponential growth is the time taken (ie.,
change
in t) for the function value to double.
We can calculate the doubling time by solving for t in the equation at = 2.
If P =
 ,
then the doubling time is
,
then the doubling time is

5. Half-life of a function that is decaying exponentially is the time taken (ie.,
change in
t) for the value of the function (dependent variable to become half the original
value.
We can calculate the half-life by solving for t in the equation at = 1/2.
If
 ,
then the half-life is
,
then the half-life is
6. Alternative formula for exponential functions: Can write a as 1 + r where
r is the
growth rate of the function and a as 1−r where r is the decay rate of the
function.
Thus the corresponding functions will be

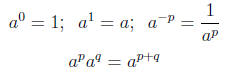
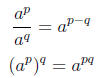
7. Rules for computing Exponents:
Logarithms
1. f(x) = loga(x) is the inverse function of y = ax. logax = c if ac = x..
2. logax is not defined if x is negative or if x = 0.
3. Rules for Computing logs:
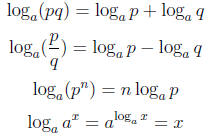
4. Logs just simplify the level of difficulty - Logs convert exponentiation
to multiplication
and multiplication to addition.
The Number e and Natural Logarithms
1. ln x = logex = c if ec = x.
2. The rules for computing ln x are the same as the rules for computing log x.
3. ex and ln x are inverse functions. Ie, eln x = ln ex = x.
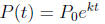
4. We can write any exponential growth function
 in the form
and any exponential decay function 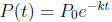 where k is positive.
5. In the above equation, we need to know how to convert between at and ekt.
Substituting
above we see that a = ek or k = ln a.
6. Can use either ln or log to solve for x in  .
.
Properties of Functions
1. Increasing and Decreasing Functions:
A function is increasing if as x increases, y = f(x) increases.
A function is decreasing if y = f(x) decreases as x increases.
2. Odd and Even Functions:
A function f is an even function if f(x) = f(−x) for all x. That is, f is even
if the
graph of f is symmetric about the y-axis.
A function f is an odd function if f(−x) = −f(x) for all x, That is, f is odd if
the
graph of f is symmetric about the origin.
3. A graph is concave up if
(a) if the function is increasing and the increase is
increasing.
That is, in the table of x and y values, for equal difference in x values, the
difference in y values is increasing as x is increasing.
(b) if the function is decreasing and the decrease is
decreasing.
That is, for equal differences in x values, the difference in y values is
decreasing
(as x is increasing).
4. A graph is concave down if
(a) if the function is increasing and the increase is decreasing.
That is, in the table of x and y values, for equal
difference in x values, the
difference in y values is decreasing as x is increasing.
(b) if the function is decreasing and the decrease is increasing.
That is, for equal differences in x values, the difference
in y values is increasing
(as x is increasing).