Rational Functions
What if instead of looking at the limit of x, we look at
the limits of a, b, c, and d in relation to our function?
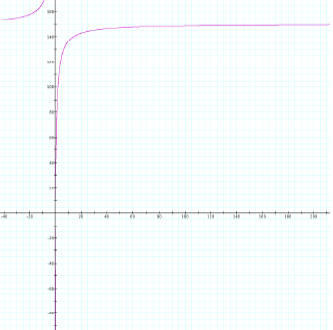
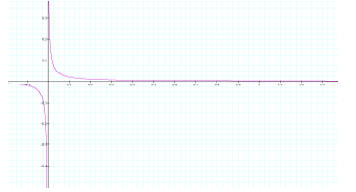
Limit of a (towards infinity):
As the limit of approaches infinity the right hand limit approaches negative
infinity and left hand limit of f(x)
approaches infinity. This happens very quickly. Below is a graph illustrating
this idea. Here, b, c, and d= 1
and n=150. While this isn’t showing a=infinity we can generalize the idea.
We also know f(x) cannot exceed the value of infinity since a horizontal
asymptote exists at a.
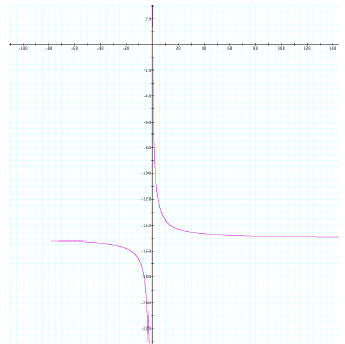
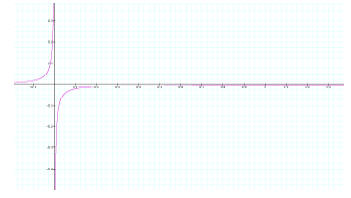
Limit of a (towards negative infinity):
Here as approaches infinity the left hand limit approaches negative infinity and
right hand limit of f(x)
approach infinity. Once again, a graph is used to illustrate this point (a=-150,
b=1, c=1, d=1). In this case,
the function approaches negative infinity rather quickly. Additionally we know
that the limit of f(x) does
not go past negative infinity since a horizontal asymptote exists at a.
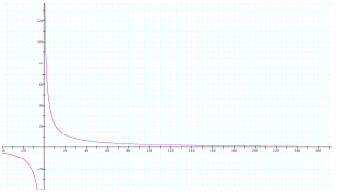
Limit of b (towards infinity and negative infinity):
Here I looked at what happens to the function f(x) if the limit of b is
examined. First, we can see that as b
goes towards infinity, the right hand limit of f(x) goes towards infinity and
the left hand limit goes towards
negative infinity. Also, if b goes towards negative infinity, the right hand
limit f(x) goes towards negative
infinity and the left hand limit goes towards positive infinity.
The first graph shows f(x) with a=230, b=1, c=1, and d=1 to illustrate what
happens when b goes towards
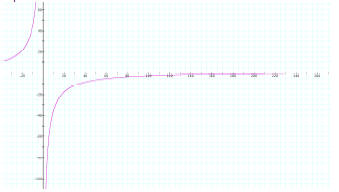
infinity. The second graph shows f(x) with a=-390, b=1, c=1, and d=1.
Graph #1
Graph #2
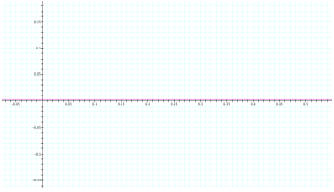
Limit of c (towards infinity and negative infinity):
Here when c approaches infinity the limit of f(x) approaches 0. We can see this
illustrated through graphs
by observing what happens when c=500, and if we let a, b, and d remain as fixed
values. When this
happens, the limit of f(x) approaches 0 from both sides. This is also true if we
allow c to approach negative
infinity. In the second graph I allowed c=-500 to illustrate this point.
Graph #1
Graph #2
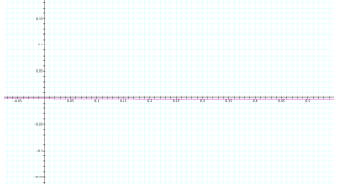
Limit of d (towards positive and negative infinity): When
a, b, and c remain fixed and d approaches positive
or negative infinity, the limit of f(x) approaches 0. The first graph
illustrates this point by showing d=500,
a=1, b=1, and c=1. The second graph shows that this also occurs when d
approaches negative infinity,
where d=-500, a=1, b=1, and c=1.
Graph #1
Graph #2
Final thoughts on a, b, c, and d:
It makes sense algebraically that as a and b approach infinity the limit f(x)
goes towards infinity and as a
and b approach negative infinity the limit of f(x) goes towards negative
infinity.
For instance, if we are looking at a going towards infinity and b, c, and d are
fixed and c and d are even
some large values (c=500, and d=1000) and b=1…we are still approaching
infinity...
Why?
Because numbers such as 9,999,999,999,999,999,999. . . are extremely large in
comparison to numbers
such as 500 and 1000.
= A very large number!
*Also, as a continues to increase the limit of f(x)
approaches infinity. The same idea holds for negative
infinity (except we are approaching negative infinity) and if we manipulate b
instead of a.
For c and d, it makes sense that as c or d approaches infinity or negative
infinity that we are approaching 0.
Why?
Well because as this happens we are essentially generating the value
f(x) = (1/9999999999999999999) or -(1/9999999999999999999) depending on whether
or not c or d is
approaching positive or negative infinity. Either way, these values become
increasingly smaller and smaller
as c and d go towards positive or negative infinity. Eventually, they are so
small that they essentially equal
0.
Mathematical Foci 5: Inverse of f(x)
Inverse of the function f(x) = (ax + b) / (cx + d)
Definition:
A function is said to be an inverse of a given function if the domain and the
range trade places. The
elements of the domain become range and vis-à-vis.
The given function is: ƒ(x) = (ax + b) / (cx + d)
The inverse of the function is: ƒ-1 (x) = (dx –b) / (-cx + a).
Below is the explanation on how to solve for ƒ-1 (x).
The inverse of the function ƒ(x) = ax + b/cx + d can be solved in several ways.
Some of these are:
a) Algebraically:
Assuming f: R→R a function and f(x) = (ax + b/cx + d).
To find an inverse of a function we assume ƒ(x) = y = (ax + b/cx + d) then cross
multiplying (cx + d) and y.
We will get cxy + dy = ax + b and if we transfer all the x’s in the same side
then we get x(cy-a) =b – dy.
Dividing both side by (cy-a) then we get x = (b-dy)/(cy-a). Multiplying both
side by -1 then we get x = (dy-b)/
(-cy+a). The last step is replacing y’s with x then we get ƒ-1 (x) = y = (dx –
b) / (-cx + a).
b) Using linear algebra method
Assume  is a 2x2 matrix and ad-bc ≠ 0.
Multiplying this matrix by a 2x1 matrix, then we get
is a 2x2 matrix and ad-bc ≠ 0.
Multiplying this matrix by a 2x1 matrix, then we get
2x1 matrix A[x] =
To find the inverse of A[x] = we must define identity matrix. Identity matrix is
denoted by Ι.
We denote the inverse of a 2X2 matrix
 is
is  such that,
 . where
I is identity matrix. Then the
. where
I is identity matrix. Then the
inverse is
 where ad-bc ≠ o. If we assume ad-bc = 1 then
[x] = .
where ad-bc ≠ o. If we assume ad-bc = 1 then
[x] = .
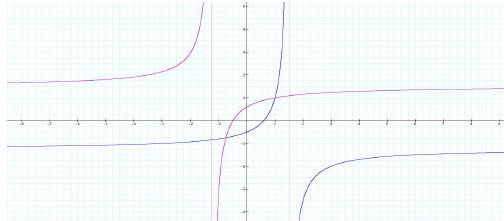
The inverse of the function has something to say about the function itself. Here
are some that we found out.
Take for example ƒ(x) = (2x+3)/(4x+5) and its inverse ƒ-1 (x) = (5x-3)/(-4x+2).
The graphs of the function
and its inverse are here below.
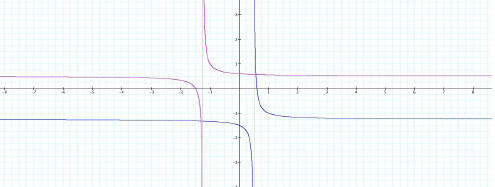
Graph 1
*ƒ(x) is in red while ƒ-1 (x) is in blue.
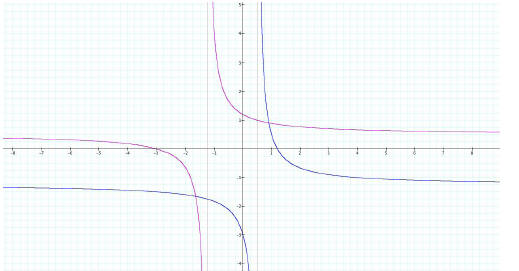
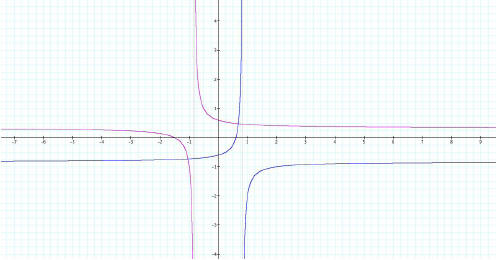
To make a reasonable observation, the graphs below are
presented. The same set of function and its
inverse is used. The value of b, c, and d are changed in graphs 2, 3, and 4
respectively.
Graph 2
Graph 3
Graph 4
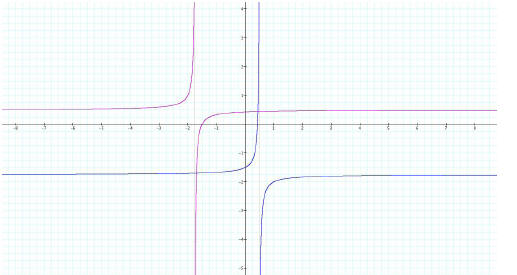
Graph 5
General observation:
The non-corresponding asymptotes of the graphs of the ƒ(x) and ƒ-1
(x) are parallel. Furthermore, the graph
of ƒ-1 (x) is reflected to the opposite direction of ƒ(x).